Comparing Top Servers vs. Top Returners on the ATP Tour
What This Page is About
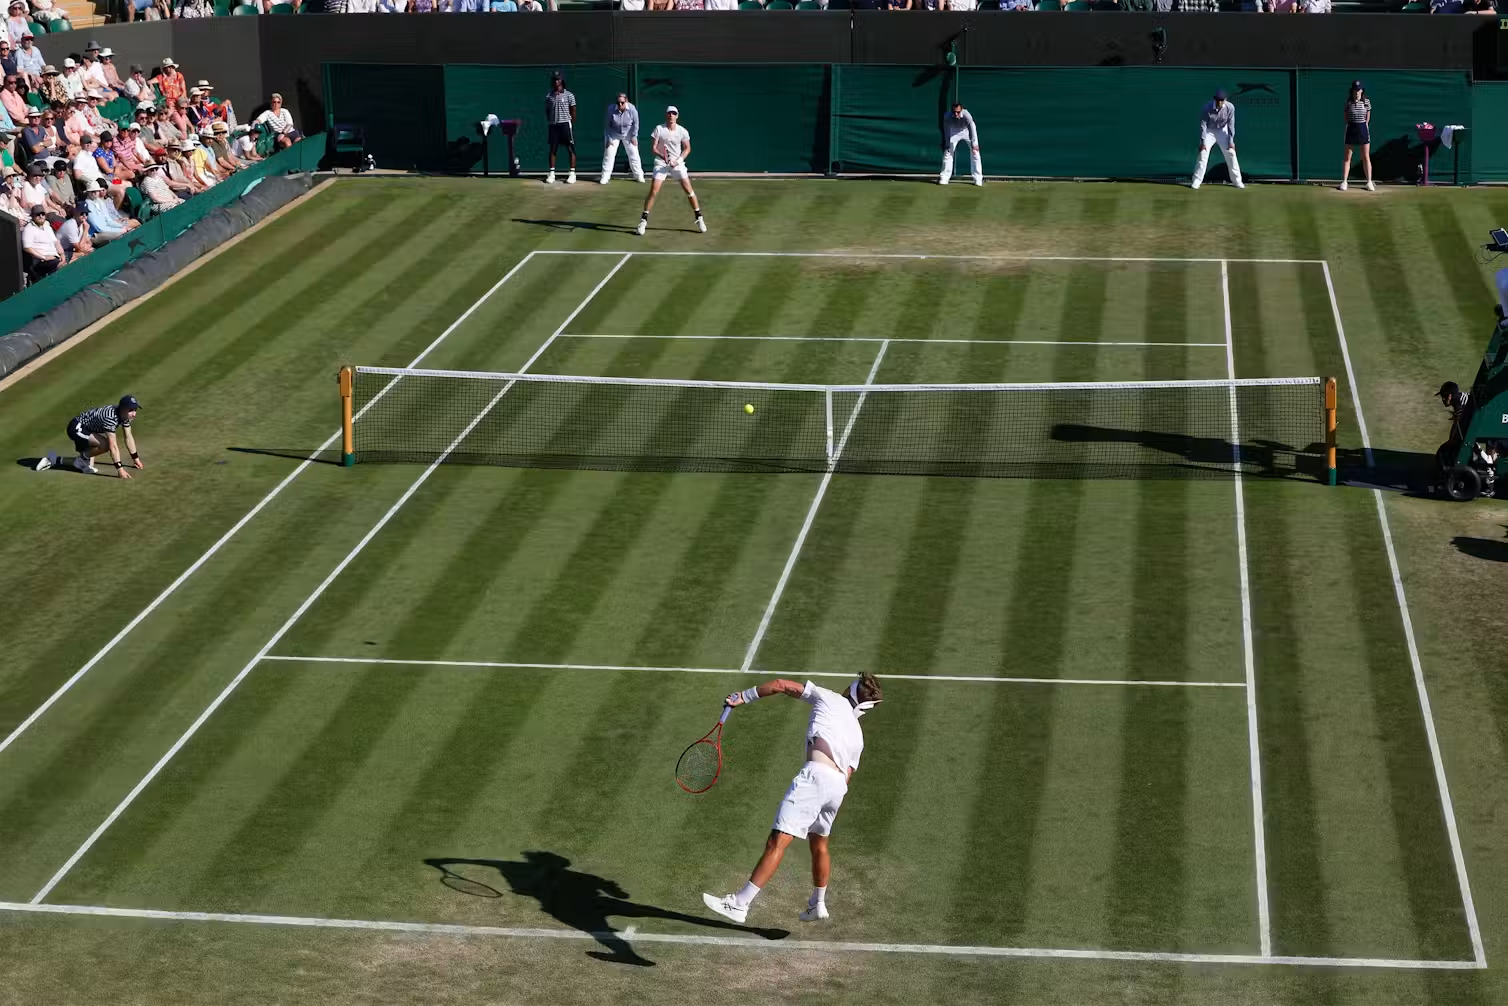
Tennis is two separate games. Half the time you are holding your own serve; the other half you are trying to break someone else's. The ATP tracks these as two entirely different leaderboards, with their own ratings and their own top tens — and almost nobody appears on both.
This page puts the serve top 10 and the return top 10 side by side so you can see who is good at which half, and what actually separates the players inside each list. Click any name and the page will find that player in both tables, pull their key numbers, and tell you what kind of player they are.
How To Use this Page
Try It — Pick a Player Click any player's row (click this to try) in either table. Their will highlight for your reference and their data will be displayed bellow in the breakdown. Click again to remove the highlight.
Hover over the column headers to see their definitions and what they mean. Example: hover over this This is the definition!
The Data
 Both tables come from the ATP
Tour Leaderboards, using the 52-week rolling window across all surfaces, retrieved
September 2026. The serve table is sorted by Serve Rating and the return table by
Return Rating — both are ATP composite scores, not raw stats.
One thing to know before you start: the two ratings run on different scales. Serve Ratings sit near 300, Return Ratings near 160. You cannot add them together to get an overall score. To compare a player across both halves of the game you have to compare their ranks, not their ratings — which is exactly what the summary box below does.
| Player |
Serve Rating A measure of overall serving performance. A higher Serve Rating means the player is generally more effective on serve. |
% 1st Serve The percentage of first serves that land in. A higher percentage can help a player avoid second-serve situations.
|
% 1st Serve Points Won
The percentage of points won when the player's first serve goes in. This helps show how effective the first serve is.
|
% 2st Serve Points Won |
% Service Games Won
The percentage of service games a player wins. This is useful for seeing how consistently a player holds serve.
|
Avg. Aces/ Match
The average number of aces a player hits per match. An ace is a serve that the opponent cannot touch.
|
Avg. Double Faults/Match
The average number of double faults a player commits per match. Fewer double faults generally means fewer free points given to the opponent.
|
|
|---|---|---|---|---|---|---|---|---|
| 1 |  Jannik Sinner |
305.3 | 65.4% | 80.7% | 58.4% | 93.5% | 8.6 | 1.3 |
| 2 |  Ben Shelton |
299.4 | 68.3% | 76.5% | 57.5% | 89.9% | 10.0 | 2.8 |
| 3 |  Alexander Zverev |
299.3 | 71.8% | 76.0% | 56.0% | 88.5% | 9.2 | 2.2 |
| 4 |  Taylor Fritz |
298.9 | 65.7% | 79.2% | 53.2% | 88.9% | 13.9 | 2.0 |
| 5 |  Giovanni Mpetshi Perricard |
297.0 | 71.2% | 76.7% | 49.5% | 86.9% | 15.9 | 3.2 |
| 6 |  Hubert Hurkacz |
294.8 | 63.3% | 79.6% | 50.6% | 88.5% | 15.7 | 2.9 |
| 7 |  Felix Auger-Aliassime |
294.2 | 67.6% | 78.1% | 51.6% | 88.8% | 10.8 | 2.7 |
| 8 |  Brandon Nakashima |
289.6 | 65.8% | 77.6% | 50.3% | 87.0% | 9.9 | 1.0 |
| 9 |  Alexander Bublik |
289.5 | 64.8% | 78.3% | 50.5% | 87.5% | 11.9 | 3.5 |
| 10 |  Arthur Rinderknech |
289.0 | 63.5% | 77.2% | 51.9% | 87.3% | 12.0 | 2.9 |
| Player |
Return Rating
A measure of overall return performance. A higher rating indicates stronger performance when returning an opponent's serve.
|
% 1st Serve Return Points Won
The percentage of points a player wins when returning an opponent's first serve. This shows how effective they are against strong first serves.
|
% 2nd Serve Return Points Won
The percentage of an opponent's service games that a player wins. This helps show how effective the player is at breaking serve.
|
% Return Games Won |
% Break Points Converted
The percentage of break-point opportunities that a player converts into a break of serve.
|
|
|---|---|---|---|---|---|---|
| 1 |  Carlos Alcaraz |
160.6 | 34.4% | 53.5% | 30.0% | 42.7% |
| 2 |  Daniel Merida |
160.5 | 32.0% | 54.1% | 29.6% | 44.8% |
| 3 | Jannik Sinner |
159.2 | 33.4% | 54.6% | 29.9% | 41.3% |
| 4 |  Rafael Jodar |
158.6 | 33.1% | 51.8% | 29.7% | 44.0% |
| 5 |  Daniil Medvedev |
158.5 | 34.0% | 53.4% | 28.3% | 42.8% |
| 6 |  Luca Van Assche |
155.2 | 31.3% | 52.9% | 28.4% | 42.6% |
| 7 |  Francisco Cerundolo |
154.5 | 31.7% | 53.4% | 29.4% | 40.0% |
| 8 |  Learner Tien |
153.2 | 31.1% | 52.9% | 26.3% | 42.9% |
| 9 |  Alex de Minaur |
152.5 | 31.2% | 53.9% | 26.4% | 41.0% |
| 10 |  Ignacio Buse |
152.3 | 30.6% | 50.3% | 25.5% | 45.9% |
What the Data Tells Us
The serve is real
Shelton has a powerful and effective serve, ranked just after Jannik Sinner for the best servers on the ATP tour.
Aces aren't the whole story
Mpetshi Perricard hits 15.9 aces a match and ranks 5th. Hurkacz hits 15.8 and ranks 6th. Sinner hits 8.4 — barely half — and ranks 1st. Shelton is only 9.8. This means that Serve Rating rewards efficiency, not power. The ace count in the table tells you almost nothing.
What are Shelton's Strengths?
Since aces don't drive the ranking, Shelton's value comes from consistency. He lands 67.9% of first serves and wins 57.6% of second-serve points — the second-best second-serve number in the entire top 25, behind only Sinner. The second serve is the shot a player can't hide, and Shelton's is the hardest to attack of any big server on this list.
What the Serve Can't Do
Shelton ranks 2nd of 50 on serve and doesn't appear in the top 50 on the ATP's Return leaderboard. Sinner and Alcaraz are top-3 on both. Holding serve keeps Shelton in matches, but he can't take his opponent's, so his path runs through tiebreaks and fifth sets — which is how his quarterfinal against Alcaraz ended at 3:33 in the morning.